School Climate and Culture Surveys
Equipping Schools with Actionable Insights to Improve Learning & Engagement
Why Schools Choose Our Survey Platform
Benefits of Using our Online Educational Questionnaires:
For students
Enhance student engagement and academic performance (including grades and test scores). Promote student well-being and mental health. Reduce bullying and other school safety concerns. Increase attendance, retention, and enrollment.
For teachers and staff
For teachers and staff: Improve employee engagement, boost morale, provide more meaningful support and professional development. Increase teacher retention..
For parents and families
For parents and families: Strengthen relationships with parents to improve student engagement and educational outcomes and increase attendance and enrollment.
Survey Solutions for Your School and/or District
Gather insights to help improve school climate and educational outcomes


Helping Schools & School Districts Thrive
We partner with schools nationwide to strengthen climate, culture, and academic performance. Our Partners Share Their Experiences with Us
Survey Samples & Questions
Access a variety of Survey Samples & Questions that can be customized to fit your needs, ensuring you get the most relevant data from your surveys.
Trusted by Our Partners


Get Started with CustomInsight
for Schools Today!
FAQs About CustomInsight for Schools
Why do districts choose CustomInsight for Schools over generic survey tools?
Most survey platforms give you data; FocalEDU gives you certainty. Our instruments are not just “questions”—they are psychometrically validated constructs designed to withstand the scrutiny of school boards and state auditors.
- Scientifically Validated: Our items are tested for reliability and construct validity, ensuring you measure exactly what you intended.
- AI-Enhanced Efficiency: Our AI doesn’t just summarize data; it identifies root causes and suggests evidence-based action plans.
- Equity-First Analytics: Automatically disaggregate data to identify gaps in the experiences of diverse student populations.
What is a School Climate and Culture Survey?
A School Climate and Culture Survey is a comprehensive diagnostic tool used to measure the “heartbeat” of an educational institution. Unlike academic testing, which measures what students are learning, climate surveys measure how they are experiencing their environment.
At CustomInsight for Schools, we define school climate through the perceptions of those who live it every day: students, educators, staff, and families.
What are the core dimensions of school climate?
A high-quality survey doesn’t just ask if people are happy; it measures specific, actionable areas:
- Safety & Wellness: Physical and emotional security, including bullying prevalence and mental health support.
- Engagement & Relationships: The strength of connections between students and teachers, and the level of family involvement.
- Environment: The quality of physical resources and the clarity of school rules.
- Teaching & Learning: Academic expectations, professional development support, and classroom climate.
Why conduct a climate survey?
The main purpose is to gather meaningful insights into how students, teachers, and families perceive their district/school. Topics in this survey include belonging and community, student-staff relationships, learning environment and academic rigor, bullying and safety, discipline, and communication. These aspects are critical as they directly impact academic success, student behavior, social-emotional development, and staff morale.
By conducting this survey, schools can identify bright spots and growth areas, develop data-driven action plans, and ultimately improve the quality of their school community and its special ecosystem.
What are the characteristics of a positive school climate?
A positive school climate is a place where students, staff, and families:
- feel a deep sense of belonging
- have healthy relationships
- feel valued for their unique identities
- feel heard and seen
- feel safe
Another element of a positive school climate and culture is having rigorous, supportive learning environments where all students’ needs are met and where all educators feel equipped to meet the diverse needs of their students.
Why is understanding School Climate and Culture important?
Understanding school climate and culture is essential because it directly impacts student achievement, staff retention, and overall school safety. While academic data tells you what students are learning, climate data tells you why they are succeeding or struggling. At myschoolsurvey.com, we help leaders realize that a positive school environment is the foundation for all other educational outcomes.
A positive school climate and culture lead to better educational outcomes and a more positive school experience for everyone involved. The research shows that a positive school climate can impact schools in the following ways (and many, many more):
- Improve academic performance, including grades and test scores
- Increase attendance
- Improve student engagement
- Increase student and teacher retention
- Reduce bullying and other safety concerns
- Promote student wellness and mental health
- Improve employee engagement
What kind of data analysis and reporting can we expect?
Based on the capabilities of FocalEDU (powered by CustomInsight), you can expect a sophisticated, interactive data suite designed to turn abstract perceptions into concrete school improvement plans.
Rather than just providing static PDFs, the platform delivers actionable insights through the following analysis and reporting features:
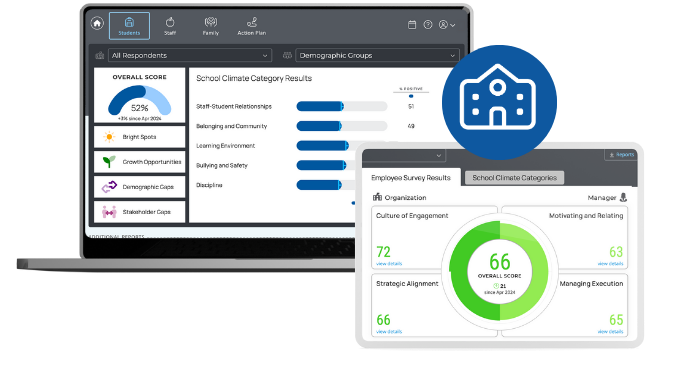
1. Intuitive & Interactive Dashboards
The hallmark of the platform is an easy-to-use dashboard that allows administrators to visualize data in real-time.
- Whole-School Snapshots: View high-level metrics across key domains like safety, engagement, and teaching quality.
- Interactive Visuals: Use color-coded graphs and charts that make complex psychometric data simple to interpret for staff and stakeholders.
2. Deep-Dive Disaggregation
One of the most critical features for equity and strategic planning is the ability to “slice and dice” the data. You can filter results by:
- Stakeholder Group: Compare perspectives between students, parents, and staff side-by-side.
- Demographic Subgroups: Identify disparities by breaking down data by grade level, race, gender, ethnicity, and department.
- Attrition Risk: Specifically for staff, the analysis helps identify “burnout hotspots” to improve teacher retention.
3. Actionable Analytics & Benchmarking
The platform doesn’t just tell you “what” the score is; it helps you understand “what to do next.”
- Strengths vs. Opportunities: Automated analysis highlights your school’s unique successes and pinpoint areas requiring immediate intervention.
- Statistically Validated Insights: Since the surveys are designed by education and psychometric experts, the reporting minimizes bias and ensures you are acting on reliable data.
- Tracking Over Time: Monitor progress across multiple survey cycles (e.g., Fall vs. Spring) to see if your interventions are actually working.
4. Presentation-Ready Reporting
To facilitate communication with boards, parents, and the community, the platform provides:
- Robust Executive Summaries: Concrete data presented in a format ready for school board presentations.
- Action Planning Templates: Guided worksheets and action charts that help leadership teams transition from “looking at data” to “implementing change.”
Do you offer a debrief of results or additional consulting?
We have designed our interactive dashboard so that the survey results are easy to interpret. We include a debrief to help you analyze your results and learn to leverage the features on our interactive dashboard. If you would like additional debriefs and data analysis support, we are happy to discuss what we can provide (including but not limited to debriefs/data analysis, training/professional development, etc.).
Should you need additional consulting, we also have a national network of consultants we work with and would be happy to refer you to one of our trusted partners.
How much do School Climate and Culture, Student Perception, and other educational surveys cost?
Our pricing is tiered based on district size and customization needs. We offer flexible packages designed to fit Title I and state-mandated budget requirements.